Carrier Performance Analytics that Improves Delivery Reliability
- Nov 28, 2025
- D2C

Carrier performance analytics becomes essential the moment your shipping data stops behaving like data and starts behaving like folklore. Many brands rely on gut feeling to choose carriers, which works right up until delays spike, surcharges multiply, and delivery windows wobble like a loose ceiling tile. Customers do not see these internal struggles. They only see late packages, inconsistent transit times, and tracking updates that look like a series of half promises. Analytics brings order to this chaos by giving you the numbers behind the movement.
Search interest around carrier analysis has risen because transportation networks have become less predictable. Regional bottlenecks, seasonal congestion, and carrier staffing swings now influence delivery outcomes more than tidy spreadsheets care to admit. Brands that do not measure carrier behavior end up surprised at the exact moments when visibility matters most.
Carriers operate in enormous networks that behave differently from one region to another. A carrier may excel on West Coast injections but struggle in the Midwest. Another may offer excellent pricing but unpredictable handoffs. These patterns only become clear when shipping data is broken down by zone, method, and geography. Without analytics, shipping feels like an expensive gamble.
Maureen Milligan, Director of Operations and Projects at G10, explains that many incoming clients lack the insight required to diagnose these issues. She notes that "most of the customers who come to us from another 3PL, their challenges have always been access to their data, order accuracy and efficiency, and meeting the committed requirements." Carrier analytics lives at the center of each of those challenges.
Assuming carriers behave consistently is one of the fastest ways to drain a shipping budget. Transit times vary widely based on lane density, local hub staffing, weather exposure, and even the type of parcel entering the network. Without tracking scan events, delay patterns, and delivery performance, it is impossible to assign shipments intelligently.
Connor Perkins, Director of Fulfillment at G10, identifies the backbone that makes carrier performance measurable. "You want everything to be scanned in the warehouse, nothing done on paper." Scanning gives you the timestamps that fuel performance reports. Paper workflows offer guesses. Scanning provides proof.
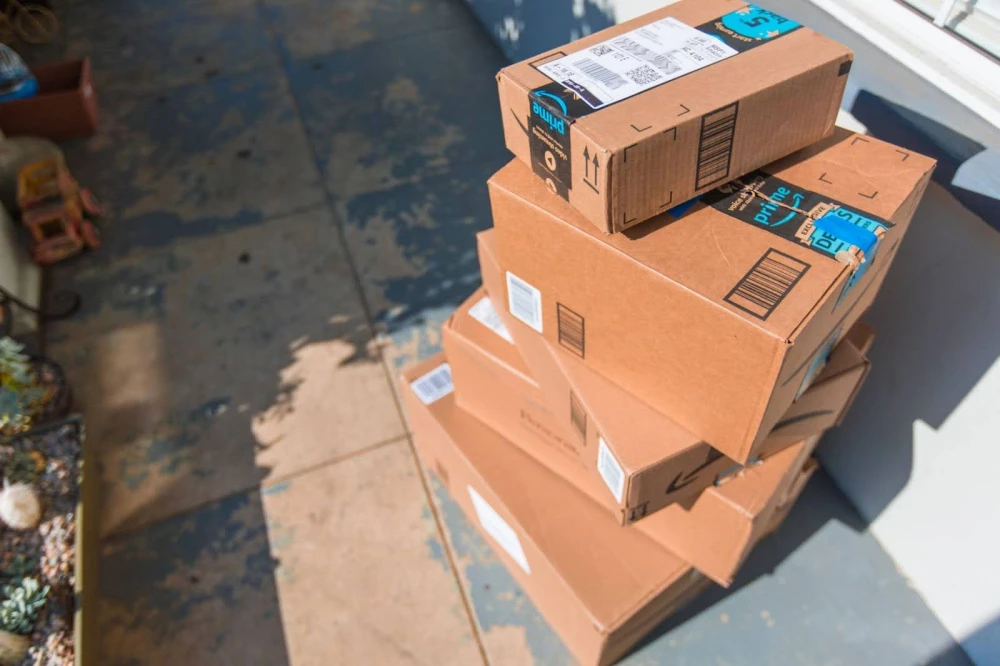
Delays are not just customer service headaches. They cause cascading problems throughout the supply chain. Late arrivals increase return requests. Missed delivery windows spoil seasonal launches. Slowdowns during peak create customer support pileups that take weeks to unwind. Analytics helps identify where those delays begin before they spread.
G10 evaluates carrier behavior using actual performance logs, not marketing promises. That means measuring first scans, in transit jumps, arrival to destination facility intervals, and final deliveries. The result is a clear picture of where carriers excel and where they drift.
Carrier networks do not behave uniformly. A carrier that shines in California may drag through Ohio. Another that delivers flawlessly in Texas may bottleneck in New Jersey. Carrier performance analytics highlights these differences so shipments can route through carriers that match the region's strengths rather than its weaknesses.
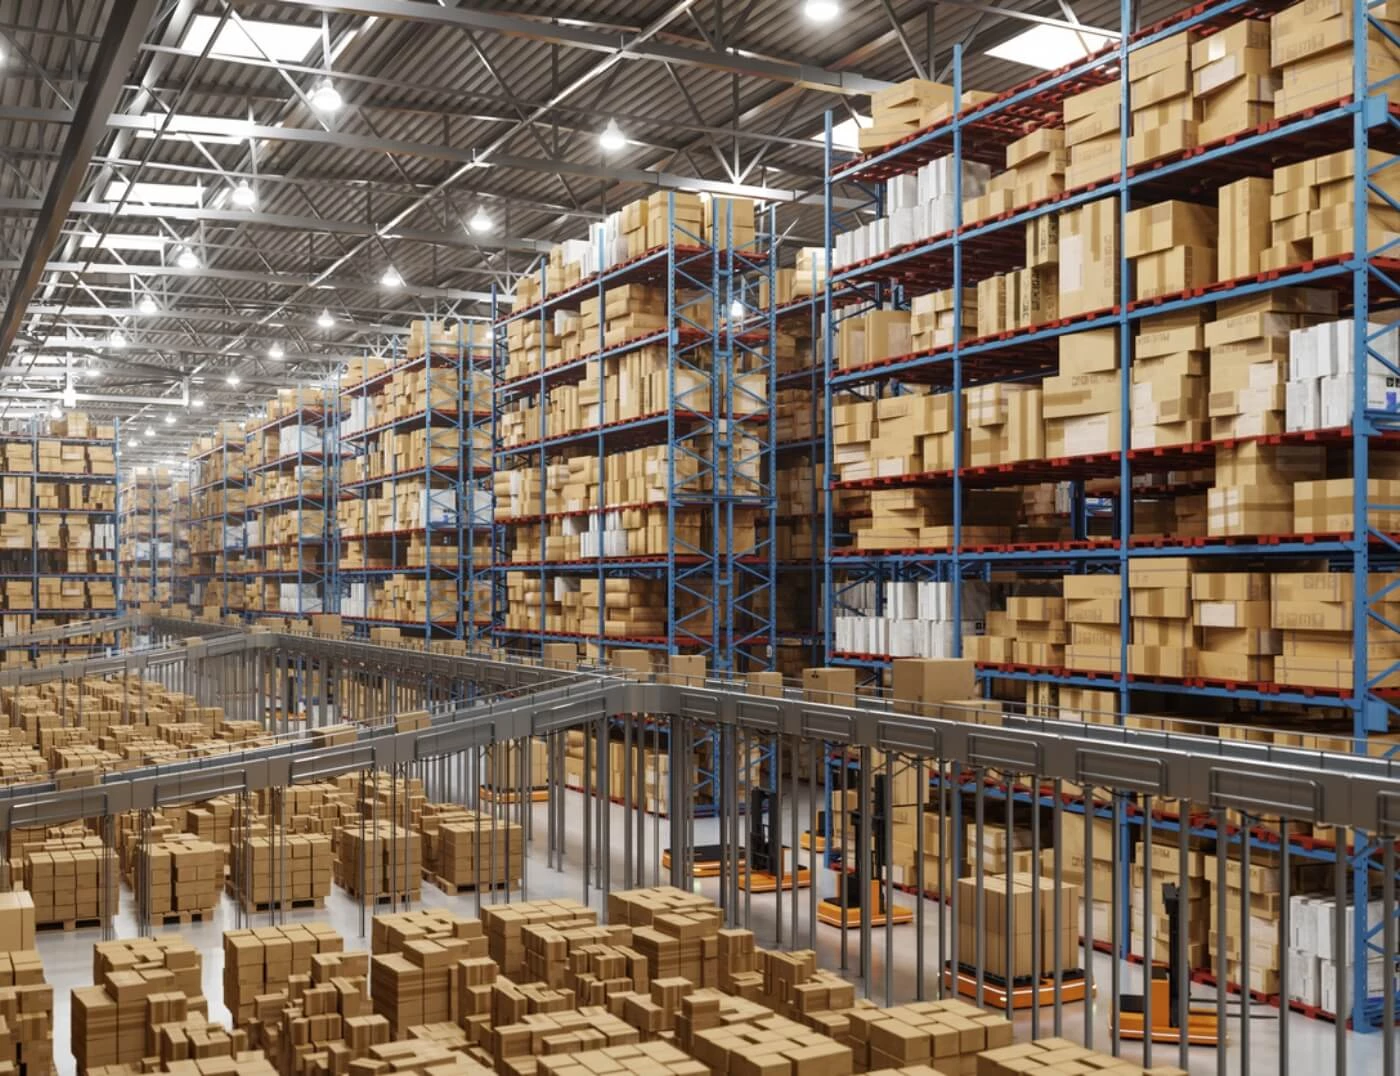
This regional visibility becomes even more powerful in a multi node network. G10 operates facilities in South Carolina, Wisconsin, Nevada, Arizona, and Texas, all connected through the ChannelPoint WMS. ChannelPoint compares delivery patterns across nodes to determine the optimal carrier for each order, not based on brand preference but on measurable performance.
Carrier contracts rely heavily on data. Carriers negotiate differently when they know a brand understands lane performance, surcharge patterns, and delivery consistency. Brands armed with analytics negotiate from a position of clarity, not speculation. They can identify which lanes deserve better rates and which ones should shift to alternate providers.
Carrier performance reporting inside G10 highlights where surcharges occur most frequently, which service levels produce the highest on time rate, and where unexpected delays surface. These insights allow brands to approach carriers with specific facts instead of vague concerns.
Warehouse automation indirectly strengthens carrier outcomes by stabilizing the outbound rhythm. Autonomous robots inside G10 facilities reduce worker fatigue, shorten pick paths, and maintain predictable throughput. When outbound schedules stay consistent, parcels inject into carrier networks at the right times, improving overall transit performance.
Holly Woods, Director of Operations at G10, highlights this connection. "The robots are allowing efficiency with pick paths. They are lowering fatigue on employees." That steadiness ripples outward into cleaner cutoffs and fewer missed pickups.
Customer support tickets spike whenever delivery performance drops. People want to know where their orders are and why they did not arrive when promised. With analytics, support teams can reference real transit benchmarks rather than improvising explanations. More importantly, analytics reduces the number of late deliveries causing those tickets in the first place.
In G10's system, scan based visibility ensures brands can see exactly when orders were packed, injected, processed, delayed, or delivered. Connor notes that clients "can see their daily orders, they can see KPIs, and they can see historical transactions." That transparency prevents confusion that otherwise turns into expensive support time.
Peak season amplifies every carrier weakness. Networks clog. Weather worsens. Hubs overflow. Brands relying on hope instead of data end up with unpredictable transit times that destroy holiday delivery promises. Analytics exposes early where the network is straining so shipments can be shifted or expectations can be adjusted.
G10 uses historical peak data combined with current cycle performance to forecast which carriers will behave predictably and which ones may need more lead time. This protects revenue during the months when delays are costly and patience is thin.
Brands that track and act on carrier performance analytics do not aim for perfection. They aim for consistency. Reliable shipments strengthen customer loyalty, reduce support costs, stabilize margins, and improve marketplace rankings. Carrier analytics transforms shipping from a gamble into a measurable, improvable system.
Mark Becker, CEO and founder of G10, articulates the long term approach clearly. "We are going to grow with them." Carrier analytics is one of the tools that enables that growth by creating predictable outcomes from unpredictable networks.
If your carrier performance feels erratic, if your delivery windows wobble, or your costs jump without warning, analytics will reveal the cause. Once you see the patterns, you can correct them. When your brand is ready to ship with clarity instead of guesswork, G10 can help you build a carrier performance program that brings stability back to your supply chain.
Transform your fulfillment process with cutting-edge integration. Our existing processes and solutions are designed to help you expand into new retailers and channels, providing you with a roadmap to grow your business.
Since 2009, G10 Fulfillment has thrived by prioritizing technology, continually refining our processes to deliver dependable services. Since our inception, we've evolved into trusted partners for a wide array of online and brick-and-mortar retailers. Our services span wholesale distribution to retail and E-Commerce order fulfillment, offering a comprehensive solution.